React Performance Tune-Up
At our recent engineering offsite my team took the opportunity not only to plan out and design some new features we’re starting to build but we also spent some time tuning our existing React application to make it even faster. Here are a couple of the quick wins we had and a few additional techniques that might help you spot bottlenecks and tune up your own app.
You can’t tune what you can’t measure, so a large part of any performance effort is properly instrumenting both your application and your testing environment to measure and analyze the deltas as you work. In the following examples we’ll be quantifying performance using some React-specific tools along with the great profiling tools already built into browsers.
Getting Wasted()
React has a ready-made set of performance measuring methods available via the Perf object from the Performance Tools library. Included is a handy function called printWasted() which reports where unnecessary work is happening in component render() methods and the virtual DOM in JavaScript that don’t ultimately cause a change in the HTML DOM.
To get setup, install the react-addons-perf package and include it in your project.
npm install react-addons-perf --save-dev
import Perf from "react-addons-perf";

// Expose the React Performance Tools on the`window` object
window.Perf = Perf;
Exposing the tools directly on the window object will allow control of performance data collection from the browser console while your app is running. Give it a try!
window.Perf.start()

// ... do some stuff with the app related to whatever components you are testing

window.Perf.stop()
window.Perf.printWasted()
TMI: Oversharing Props
The printWasted() reports are a great way to reveal places in your app where you might be passing too much information through your component stack, causing unnecessary render() calls, even when you’re optimizing with PureRenderMixin.
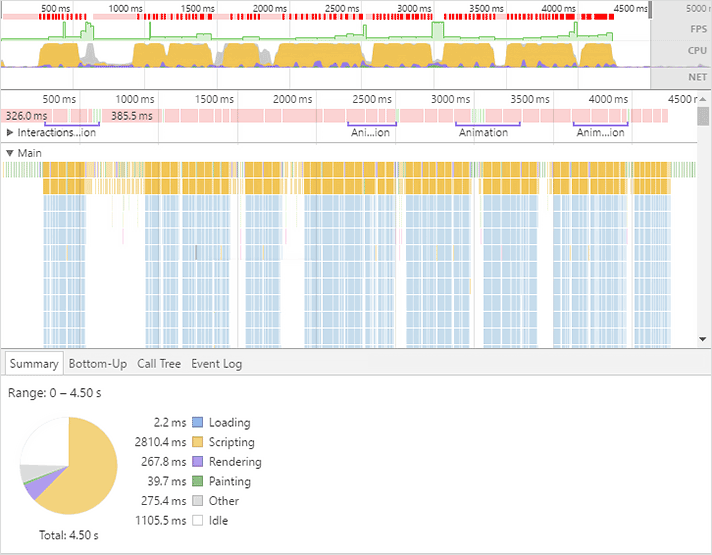
As we were developing our app we initially had a small section of our Redux store tracking a couple client-side only UI states. For velocity of early development, we simply passed that entire object through to the various components that used it. As is typical though, that part of our store grew over time and as you can see from this report our components were doing a lot of unnecessary work.
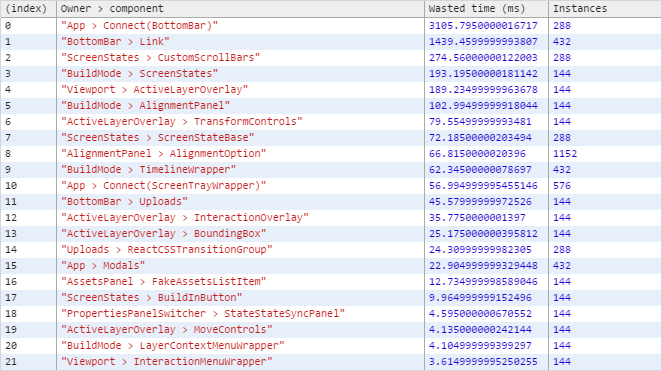
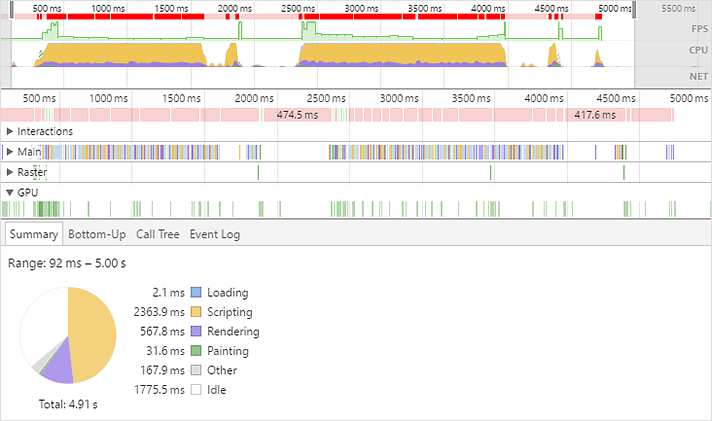
It is also very apparent on the CPU profile and flame chart from the Chrome DevTools Timeline that our app was very busy in scripting land.
After some refactoring to prune props from being passed to components where they weren’t used you can see a huge improvement in both the printWasted() report and the Timeline profile.
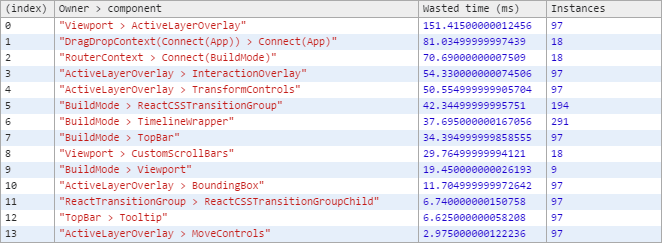
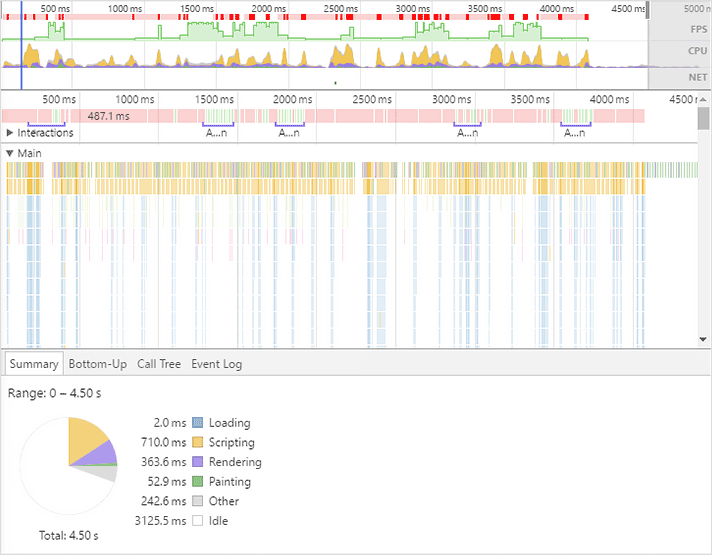
Though we were able to achieve these gains through straightforward pruning of unused props being passed through our component stack, there are cases where you could improve performance further by rerouting data flow. When you find some intermediate components with substantial wasted time that are only receiving certain props so that they can then be passed through to children, you can side-step triggering those unnecessary render() calls by using something like Redux’s connect to directly provide any props required by deeply nested child components. This does lead to tight coupling between your components and a specific state container technology (e.g. Redux), and makes them less reusable, so make sure the performance gains are material and your intentions well documented.
Alternatively, there is also React’s Context, though as an experimental feature with some counterintuitive behavior and the potential to obscure data flow through your app, I wouldn’t recommend it.
Getting out of a bind()
Another thing to watch out for if you are finding a component wasting time unexpectedly, even when you are optimizing with PureRenderMixin or your own shouldComponentUpdate() check, is that doing a bind() in your render() method for a function that you pass to children components as props will create and send a new function each time. This means that the nextProps provided to the child’s shouldComponentUpdate will be different when you might not expect them to be.
// Creates a new `handleUpload` function during each render()
<TopBar handleUpload={this.handleUpload.bind(this)} />

// ...as do inlined arrow functions
<TopBar handleUpload={files => this.handleUpload(files)} />
When possible, bind() any passed functions in the component’s constructor so they are bound only once during creation and then reused during the entire lifecycle of the instance.
class App extends React.Component {

  constructor(props) {

    super(props);

    this.handleUpload = this.handleUpload.bind(this);

  }

  handleUpload(files) {

    // Upload 'em...

  }

  render() {

    <TopBar handleUpload={this.handleUpload} />

  }

}
There is also a helpful eslint-plugin-react rule called jsx-no-bind to help find these inefficient inline bind() and arrow function props in JSX.
I got this, DOM
One great way to improve performance of React components is to minimize mutating the DOM at all and moving work over to CSS where possible. The below example shows a performance snapshot where a drop target indicator for reordering list elements used a React component that was being reordered directly in the DOM along with the list items while mouse dragging.
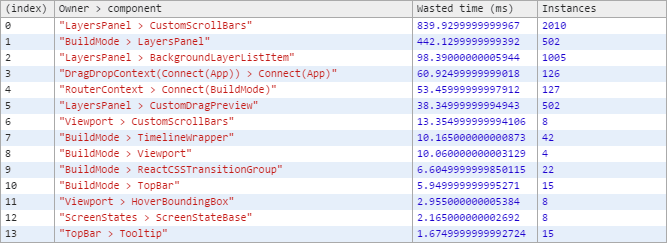
You can see all the wasted time, in our case largely due to a bunch of element position, offset and dimension calculations happening for our CustomScrollBars component, which doesn’t actually change since the list elements and their layout are constant while dragging in our UI.
The Timeline profile confirms the slowness experienced in the UI while dragging.
A more efficient way to implement this is to use a single persistent element, in this case implemented via a stateless function component, that is then positioned via CSS transform, without needing to reorder any DOM elements at all.
const ReorderIndicator = props => {

  const {index} = props;

  const styles = {
    transform: `translateY(${POSITION_OFFSET * index}px)`
  };

  return (
    <div style={styles} />
    );

};
With that change, BuildMode > LayersPanel is no longer wasting any time, and wasted calls to the LayersPanel > CustomScrollBars have dropped from over 2000 to just 2.
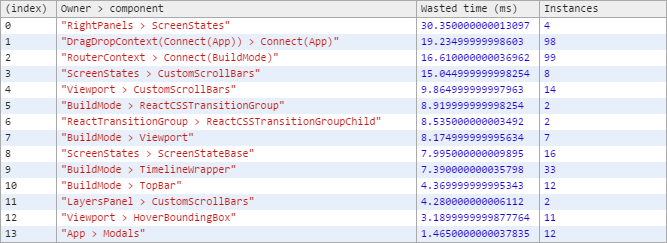
The CPU is also no longer saturated by scripting and the FPS is much improved!
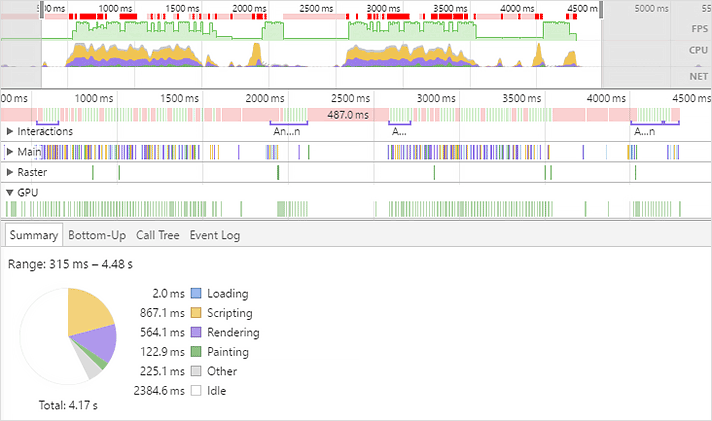
We can also clearly see that converting the reorder indicator positioning to use the CSS transform property is allowing that work to move onto the GPU.


Profiling Tips
Here are some tips for improving the signal-to-noise ratio during your profiling sessions.
-
Disable browser extensions (unless of course your React app is a browser extension!) since their interactions with your page and memory usage can appear in profiling data and heap snapshots. (You can spot these extension-related items, if present, as having a
chrome-extension://prefix)
-
Trigger garbage collection by clicking the trash can icon immediately before starting a Timeline profile recording and also just before stopping so you have a consistent baseline from which to detect possible heap, node or listener leaks.
-
If you create vendor bundles as part of your build process (like with Webpack’s DLLPlugin) disable that while you profile so you’ll see original file names and locations, making it easier to explore and understand call stacks.
-
If you are minifying/uglifying code, disable that step while you profile so you’ll see non-obfuscated function and variable names.
-
Enable sourcemaps if you are transpiling and/or bundling with Babel, Browserify, jspm, closure, traceur, etc.
-
Build or include the React library for your project in
NODE_ENV=productionmode to avoid the development-onlyPropTypeschecking code calls and related performance overhead.
Additional resources
Along with the existing Network Throttling tool available in Chrome, there is also a recently added CPU Throttling tool now in Chrome Canary, so you can experience your app as someone that isn’t using your amazing supercharged and fully upgraded development machine. Since this will increase the timing measurements for function calls it can also make it easier to drill down into flame charts that have a lot of fast calls.

More and Faster
I hope you find these techniques helpful and are inspired to spend some time profiling and tuning your own app… your users will thank you! Feel free to share some of your own React tuning tips in the comments and let me know what other performance topics would be of interest for me to explore next time (CPU profiling, network tuning, memory optimization and leak detection, incremental rendering via React Fiber, etc.)