Adapting to Serverless Computing with AWS Lambda
Recently, we at InVision switched our image processing from using a self managed traditional service to using AWS Lambda for better performance, throughput and reliability. Every day, InVision processes over 250K Sketch or Photoshop artboard images uploaded through Craft Sync. Our self managed service did the job, but it inherently came with maintenance and monitoring overhead, which was a drag on our development velocity. When we needed to make a major change, we took the opportunity to try a new approach: “serverless computing” with AWS Lambda.
What is AWS Lambda?
AWS Lambda has grown quickly since its launch in 2014. The service allows you to run code with instantaneous horizontal scaling to parallel process tasks without having to worry about operations or servers. Essentially, each invocation of your Lambda “function” is executed on a fresh EC2 instance with dedicated resources. Capacity provisioning, monitoring, deployments and logging are all handled via AWS. Thanks to a fee structure where prices are based on 100ms blocks of execution time over-capacity and under-capacity events are virtually eliminated with significant cost savings.
Lambda has proven to be a simple and reliable way to perform event driven, scalable processing of our images. By switching to using Lambda, we successfully simplified our infrastructure, reduced our system monitoring overhead, and reduced our AWS bill.
When we first started investigating Lambda as a possible solution, we had all of the typical questions of any team new to Lambda:
- How do we test our code?
- Can we replicate the AWS Lambda environment in tests?
- How will we deploy?
- How will we invoke Lambda?
- How will we be notified of Lambda completion?
- How will we handle monitoring and logging?
- How will we allocate memory, CPU cycles, etc?
Eventually, through trial and error, we settled on a set of processes, tools and AWS configurations that met our requirements.
Invocation
Actually running your Lambda code is easy. AWS provides multiple “triggers” to invoke a Lambda function, such as:
- Events on S3 buckets (file uploads, file deletes, etc)
- A DynamoDB database operation
- An SNS message
The key takeaway here is each invocation gets a fresh, dedicated EC2 instance. AWS will take care of running your code on as many EC2 instances as you can send triggers. Need to process 10 or 1,000,000 things in parallel? No problem, AWS will instantly scale allocated hardware to your processing needs.
Our image processing system invokes Lambda via both S3 bucket event and SNS triggers.
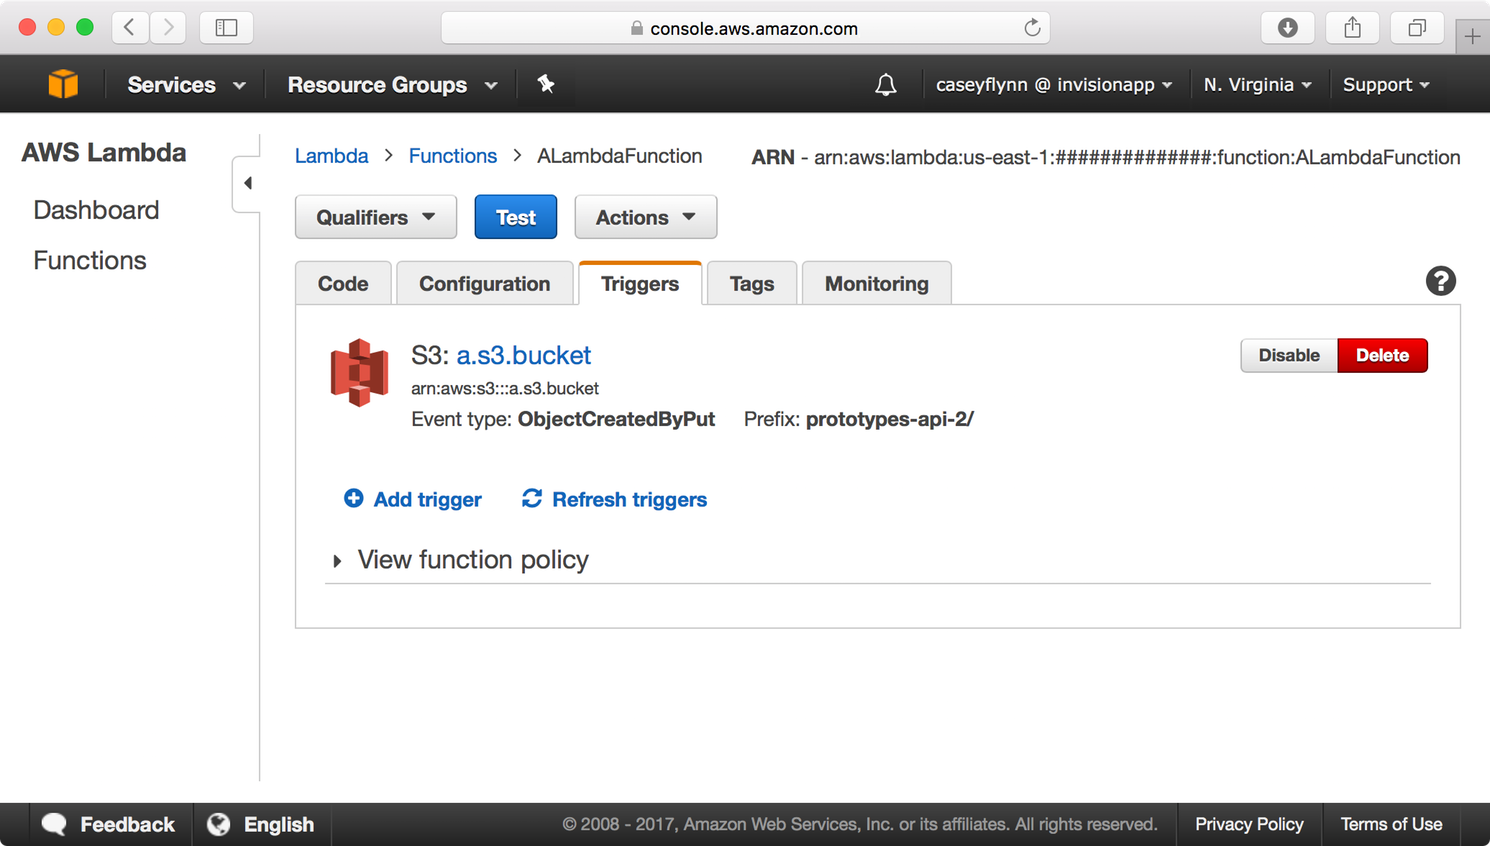
When our Lambda function is invoked via SNS or an S3 event, the message passed to the function contains all the relevant information to perform a task (such as image file location, mutation parameters, file final location, etc) When our Lambda function completes, it notifies other services by enqueuing a message in SQS.
Resource allocation
AWS gives you the option to select how much CPU and RAM are available to your Lambda function per invocation. You can select from 128MB to 1.5GB of RAM. CPU plus other resources will be allocated proportionately to the amount of RAM you select. Cost per 100ms block of execution time is correlated to resource usage. For example, 100ms of execution time at 128MB costs $0.000000208 and 100ms of execution time at 1.5GB costs $0.000002501 (12x increase over minimum).
Key Takeaway: Depending on your processing needs, it may be cheaper if your Lambda function uses more resources but completes in less time.
Deploying
There are several ways you can update your Lambda function code. The most simple is to just edit the code inline with the AWS UI. This is useful when you’re just starting out and you want to test, but for any production-level SaaS product, like InVision, this doesn’t scale.
To deploy our Lambda function, we settled on a process that uses our CI system as well as our automated deployment bot.
When a feature branch of the repository that hosts our Lambda function code is merged into master:
- Our CI system runs the tests
- Builds a zip archive of our Lambda function code
- Uploads that to S3 as an artifact
Then when we’re ready to deploy our Lambda function, we issue a command to our automated deployment bot in Slack, which in turn sends an API request to AWS to update the code of the Lambda function from the artifact hosted in S3.
Testing
One of our earliest concerns was how can we effectively simulate the environment of Lambda for testing and local development. We accomplished this with Docker and running our code and tests inside a container based on the lambci/lambda image from Docker Hub. This image mimics the AWS Lambda execution environment.
For functional testing we run the Lambda function inside a docker-compose managed environment with simulated external dependency services such as S3 and SQS. The simulated external dependencies are simply linked containers running small servers with “canned” API responses to specific S3/SQS API requests. This approach allows us to build and test our Lambda function locally with predictable results without having to constantly deploy to AWS during development.
Here are some key files from our testing environment setup
Dockerfile
FROM lambci/lambda
COPY functions/screen-resize /var/task
ENV NODE_PATH=/var/task
docker-compose.yml
app:
	build:
		dockerfile_path: Dockerfile
	cached: true
	entrypoint: npm
	#volumes:
	# - ./functions/screen-resize:/var/task
	environment:
		- "AWS_S3_OVERRIDE_ENDPOINT=http://fake_s3.local"
	links:
		- "nginx:the-perm-bucket.fake_s3.local"
		- "nginx:fake_sqs.local"

nginx:
	container_name: nginx
	image: jwilder/nginx-proxy
	add_docker: true
	volumes:
		- /var/run/docker.sock:/tmp/docker.sock
	ports:
		- "80:80"
		- "443:443"
	expose:
		- "80"
		- "443"
	links:
		- fake_sqs
		- fake_s3

fake_s3:
	# command: nodemon server.js
	build:
		dockerfile_path: ./functions/screen-resize/tests/fakeServices/s3/Dockerfile
	#volumes:
	# - ./functions/screen-resize/tests/fakeServices/s3:/var/www
	expose:
		- "80"
	environment:
		- "SILENCE_LOGS=1"
		- "VIRTUAL_HOST=the-perm-bucket.fake_s3.local"
		- "PORT=80"

fake_sqs:
	# command: nodemon server.js
	build:
		# image: node:6.3.1-slim
		dockerfile_path: ./functions/screen-resize/tests/fakeServices/sqs/Dockerfile
	#volumes:
	# - ./functions/screen-resize/tests/fakeServices/sqs:/var/www
	expose:
		- "80"
	environment:
		- "SILENCE_LOGS=1"
		- "VIRTUAL_HOST=fake_sqs.local"
		- "PORT=80"
We have our Lambda function code running inside the app container, and our fake s3 and sqs services. The nginx container takes care of routing requests within the integration testing environment. This setup is a reasonable local emulation of the AWS environment in which we can run our tests.
Monitoring
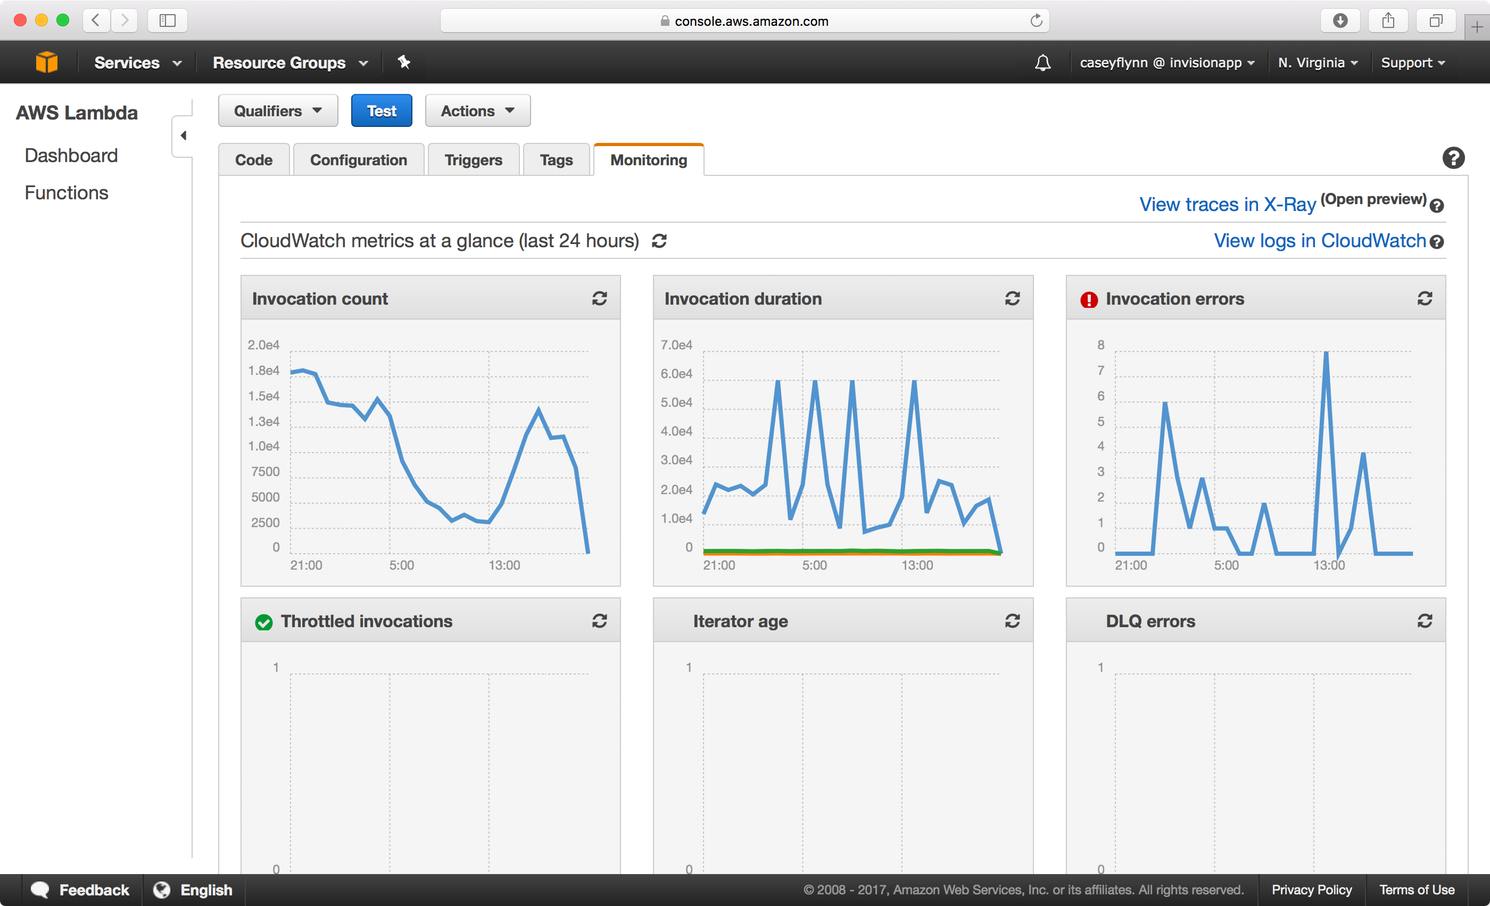
We need to know how quickly images are being processed in our system, and we need to be alerted if anything breaks. We explored several monitoring approaches when developing our Lambda based image processing system.
We started by using the tools provided by AWS. Any output sent from your Lambda to stdout or stderr will be captured and stored in CloudWatch. You can also configure a CloudWatch Alarm to notify if invocations of a Lambda function report errors. The AWS UI will report information regarding error counts, execution times, and account limit invocation rate throttling.
CloudWatch worked decently well, however we at InVision are heavy users of DataDog and we wanted to integrate our Lambda function directly with our existing monitors in Datadog. Fortunately, there is a Datadog-AWS integration for Lambda that makes it easy to get timing and count stats in your DataDog account from Lambda.
We knew we wanted to avoid making API requests to Datadog directly from our Lambda function. Since Lambda billing is based on execution time, making an HTTP request to DataDog’s API would delay a Lambda function completion and add cost overhead. The Datadog-AWS integration allows you to send stats to DataDog from Lambda by simply logging to stdout in a specific format.
For example:
MONITORING|unix_epoch_timestamp|value|metric_type|my.metric.name|#tag1:value,tag2
The integration will take care of collecting your stats and your lambda function execution time wont be affected.
To monitor our system, we use CloudWatch for inspecting Lambda logs as well as DataDog for performance stats tracking and alerting. We rely on a combination of stats reported from both our Lambda function itself, as well as services that invoke Lambda and ingest the output of our lambda. We alert if lambda execution times exceed our configured threshold.
Conclusion
The serverless computing processing model creates new opportunities to build more efficient, simple and scalable software. As with any new technology, understanding it can take time. Now that we’ve tested Lambda, we’ve found it to be a reliable and useful tool and we’re excited about additional opportunities to use it in the future.